When it Comes to Water, Think Global
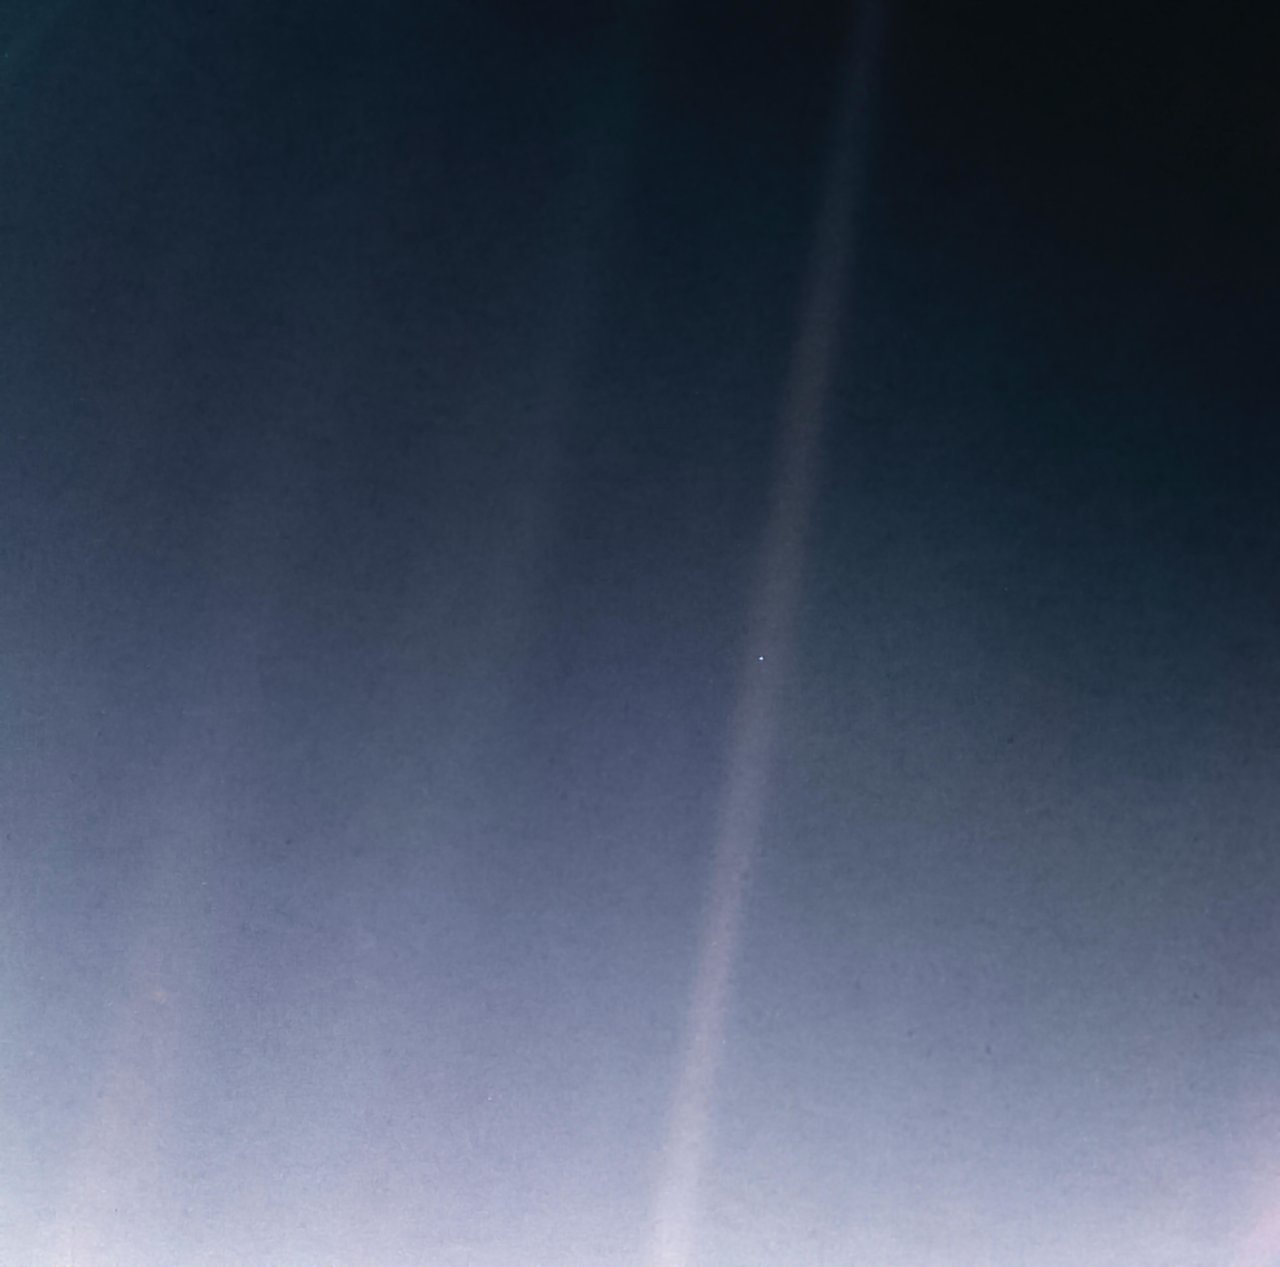
A pale blue dot. A mosaic of 60 images make up this famous NASA Voyager 1 view of Earth. Credit: NASA
Earth is a pale blue dot when seen from space. Its blue color is due to our home planet being 71% covered in water. NASA monitors Earth's water from space, the skies, ground stations on land, ships sailing the seas and even with apps on mobile phones.
While Earth is so wet that it looks blue from space, most of that water is saltwater. Only 2.5% of water on Earth is fresh water, and nearly all of that water is frozen—locked up in polar ice caps, glaciers and other ice. The small amount of fresh water that remains is all that's available for all the ways we use water.
"All the water on Earth already exists. We can't make more," said Bradley Doorn, program manager for NASA Earth Applied Sciences' Water Resources program area. "We can only track it, predict it and protect it as it cycles around our world."
NASA tracks nearly every aspect of this water cycle — as precipitation falls from clouds; as groundwater; as water soaks into soil; as it moves into rivers and lakes; as it is taken up by plants, used by animals and evaporates back into the atmosphere.
"Water is a precious resource on this planet, and one that NASA is at the cutting edge of monitoring," said Doorn.
The cyclical nature of fresh water moving around our world has led to the overarching science question that NASA is trying to answer about water on our world—where it is, when it is and in what condition. To a finer and finer degree, NASA research scientists are determining how much and when fresh water is available worldwide. As these core science questions are being asked and answered, NASA is also looking toward developing and strengthening new and innovative ways data are used to track both the use and quality of the world's fresh water. In addition, as the world warms due to climate change, NASA scientists are investigating how the world's water cycle is affected by and has effects on Earth's climate.
NASA’s Earth Science Division studies fresh water using data collected in many ways, including satellites, airborne missions and even information collected by volunteers. NASA scientists study water in nearly all of its aspects on Earth: as precipitation, ice and snow, in groundwater reserves and in lakes and rivers, just to name a few. A few examples of the research focus NASA scientists take to studying water include ways to track water quality, determining water availability and predicting drought, measuring irrigation and water use for agriculture, and world-wide precipitation.
What Goes Up Must Come Down
The amount of precipitation falling on Earth at any given time varies greatly from place to place, so having a satellite-level view provides more uniform observations around the globe because it includes data over the world's oceans and is more complete than most on-the-ground measurements.
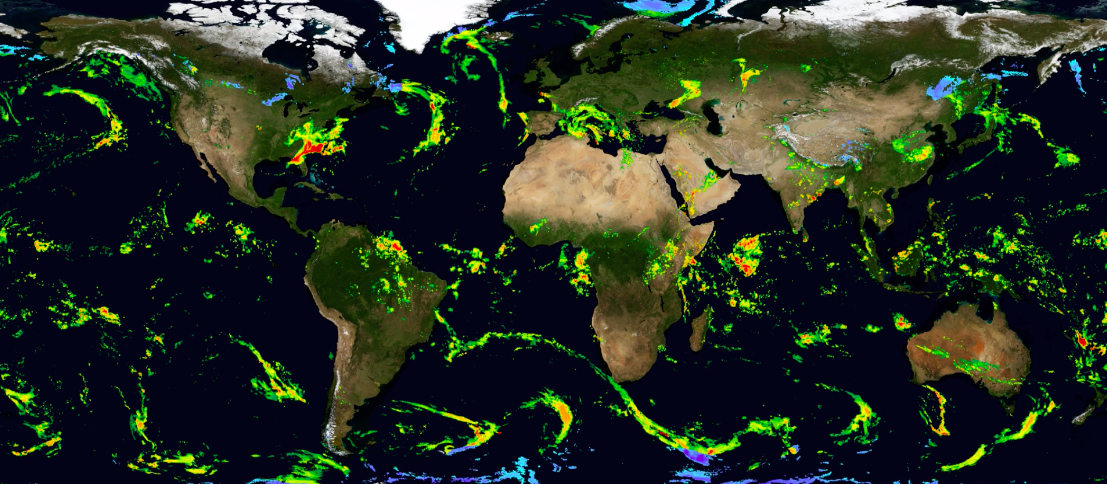
NASA's IMERG data showing world-wide precipitation on April 20, 2020. Credit: NASA/GPM
In 2019, scientists released a worldwide precipitation data set that compiled more than 20 years of satellite and other data. It is based significantly on information collected by the joint NASA and Japan Aerospace Exploration Agency (JAXA) project the Global Precipitation Measurement mission (GPM) and an earlier, precursor NASA-JAXA satellite mission the Tropical Rainfall Measurement Mission (TRMM). This Integrated Multi-satellitE Retrievals for GPM (IMERG) also includes information from a constellation of other Earth-observing satellites, airborne campaigns and ground stations.
All told, the record compiles data from 1997 to the current day. These records include four-dimensional views of rain, snow, sleet and storms, how heavy the precipitation is and how it changes over time. While IMERG produces a higher accuracy product that takes time to process and prepare, a near-real-time summary of global precipitation is available every half-hour that is used for time-sensitive applications like weather forecasting and disaster recovery. This multiple-decade baseline of rain and snow data worldwide shows how precipitation may deviate from normal, informing models that predict crop yields, disease outbreaks and landslides.
Seeing Stressed Plants
One project currently working toward including IMERG data as a larger effort to monitor agriculture is led by Christopher Hain of NASA's Marshall Space Flight Center in Huntsville, Alabama. He and his team have built a world-wide global agricultural monitoring tool that provides early drought warnings by looking at "vegetation stress."
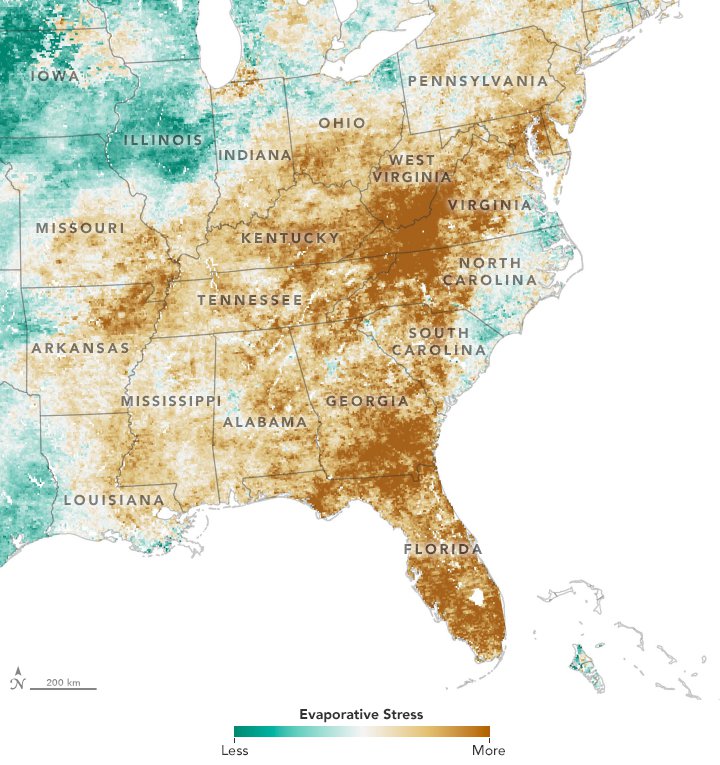
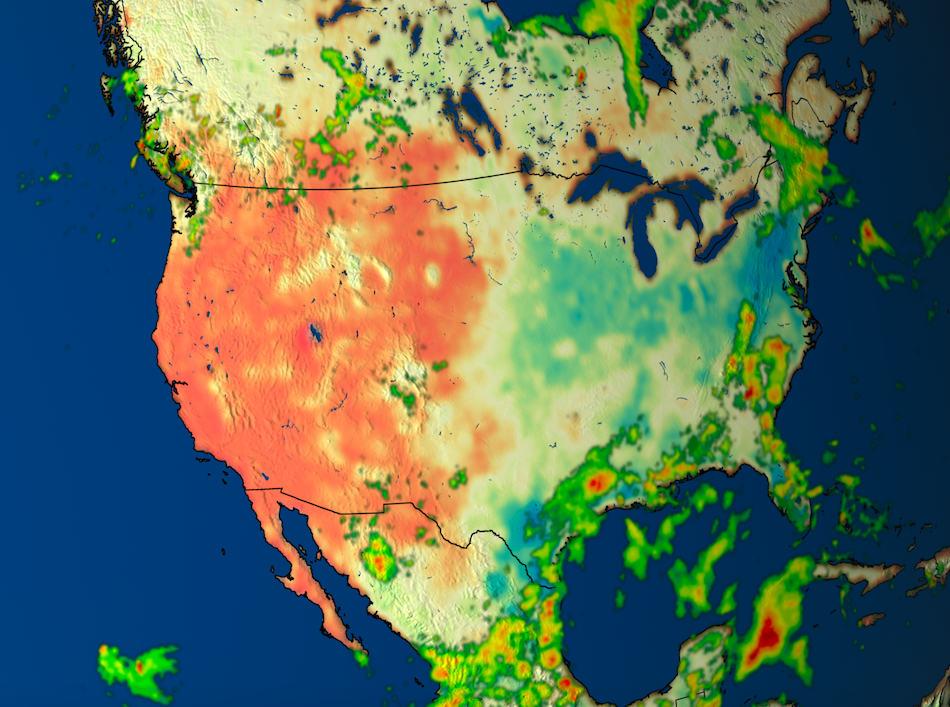
The Evaporative Stress Index drought indicator captured a "flash drought" in the eastern U.S. in 2019. Credit: NASA Earth Observatory.
About 31% of all fresh surface water in the U.S. is used for agriculture irrigation, according to the U.S. Geological Survey, and plants go under stress when they don't have enough water. When a plant releases water from its leaves, in a process called "transpiration," it cools them. This allows farmers to track the temperature readings of a field over time as a way of determining the health of their crops. If a field is unusually warm, it shows the plants are under stress long before leaves fade and turn brown.
This plant stress is quantified in part by these temperature changes into the Evaporative Stress Index. It's used in many different products and is incorporated into the U.S. Drought Monitor, a map developed the U.S. Department of Agriculture (USDA). Updated on a weekly basis, it ranks drought conditions across the U.S. As part of a NASA Earth Applied Sciences-funded project, Hain's team is expanding the use of this data beyond the U.S. to a world-wide "Global Evaporative Stress Index."
In addition to the IMERG data, this index includes a plant temperature indicator taken from NASA's ECOsystem Spaceborne Thermal Radiometer on Space Station (ECOSTRESS) instrument, which was launched to the International Space Station in 2018. Also contributing to the index are land surface temperatures from many National Oceanic and Atmospheric Administration (NOAA) satellites, observations from the NASA's Terra and Aqua satellites and the NASA/NOAA Suomi National Polar Orbiting Partnership (Suomi NPP) satellite.
This index of plant stress also includes data from the Landsat series of satellites; the longest continuous record of Earth science data from space. Begun in 1972, Landsat is a partnership between NASA and the U.S. Geological Survey (USGS) and Landsat data is used in NASA Earth Applied Sciences water projects as varied as measuring from the stress on vineyards in California to tracking scarce water resources in remote areas of the Navajo Nation.
Managing Water in the West
In the drought-prone Western U.S., water is a particularly scarce resource, which is why in 2015 NASA's Earth Applied Sciences Water program area established the Western Water Applications Office (WWAO). It facilitates getting satellite and other NASA data into the hands of western state, local and federal water agencies.
"Managing water in the western United States is particularly challenging," says Indrani Graczyk, WWAO manager. "That's because most precipitation falls in winter and is stored in mountain snowpack, but must supply users throughout the long, dry summers.

One of the two Twin Otter aircraft used by the Airborne Snow Observatory mission to study snowpack in the Western U.S. Credit: NASA.
One of many NASA programs that investigate the important connections between snow and water availability is the Airborne Snow Observatory. This multi-year NASA aircraft project began in April 2013 and was a collaboration between NASA's Jet Propulsion Laboratory (JPL) and the California Department of Water Resources. It created the first maps of the entire snowpack of two major mountain watersheds in California and Colorado, producing the most accurate measurements of how much water they hold, a boon to the millions of Americans relying on those water basins for their water supply.
The Airborne Snow Observatory project also made the first measurements of snow in the area created by surrounding mountains, known as a 'basin,' as well as on the mountains themselves. This understanding of precipitation in mountains provides data that are now being incorporated world-wide to help improve water management for the 1.5 billion people globally who rely on snow melt for water.
Data in the Palm of Your Hand
In addition to satellite and airborne missions, NASA is also using the power of citizen scientists to monitor the world's water resources. One example is NASA's Global Learning and Observations to benefit the Environment Program (GLOBE) program. Begun in 1995, this worldwide program and brings together students, teachers, scientists and citizens and through its GLOBE Observer mobile phone app, users can upload information about cloud cover, rainfall depth and other information which is then relayed to scientific teams who use it as part of their research in monitoring water resources worldwide.
Another hand-held scientific resource is CyAN, an android mobile phone application that's part of the multi-agency Cyanobacteria Assessment Network, (CyAN). The network began in 2015 with a goal developing a uniform and systematic approach for identifying potentially harmful algal blooms using satellite and other data. While individual algae are microscopic, under the right conditions they can multiply and "bloom" and release harmful toxins that can sicken people and pets, contaminate drinking water and force closures of boating and swimming sites.
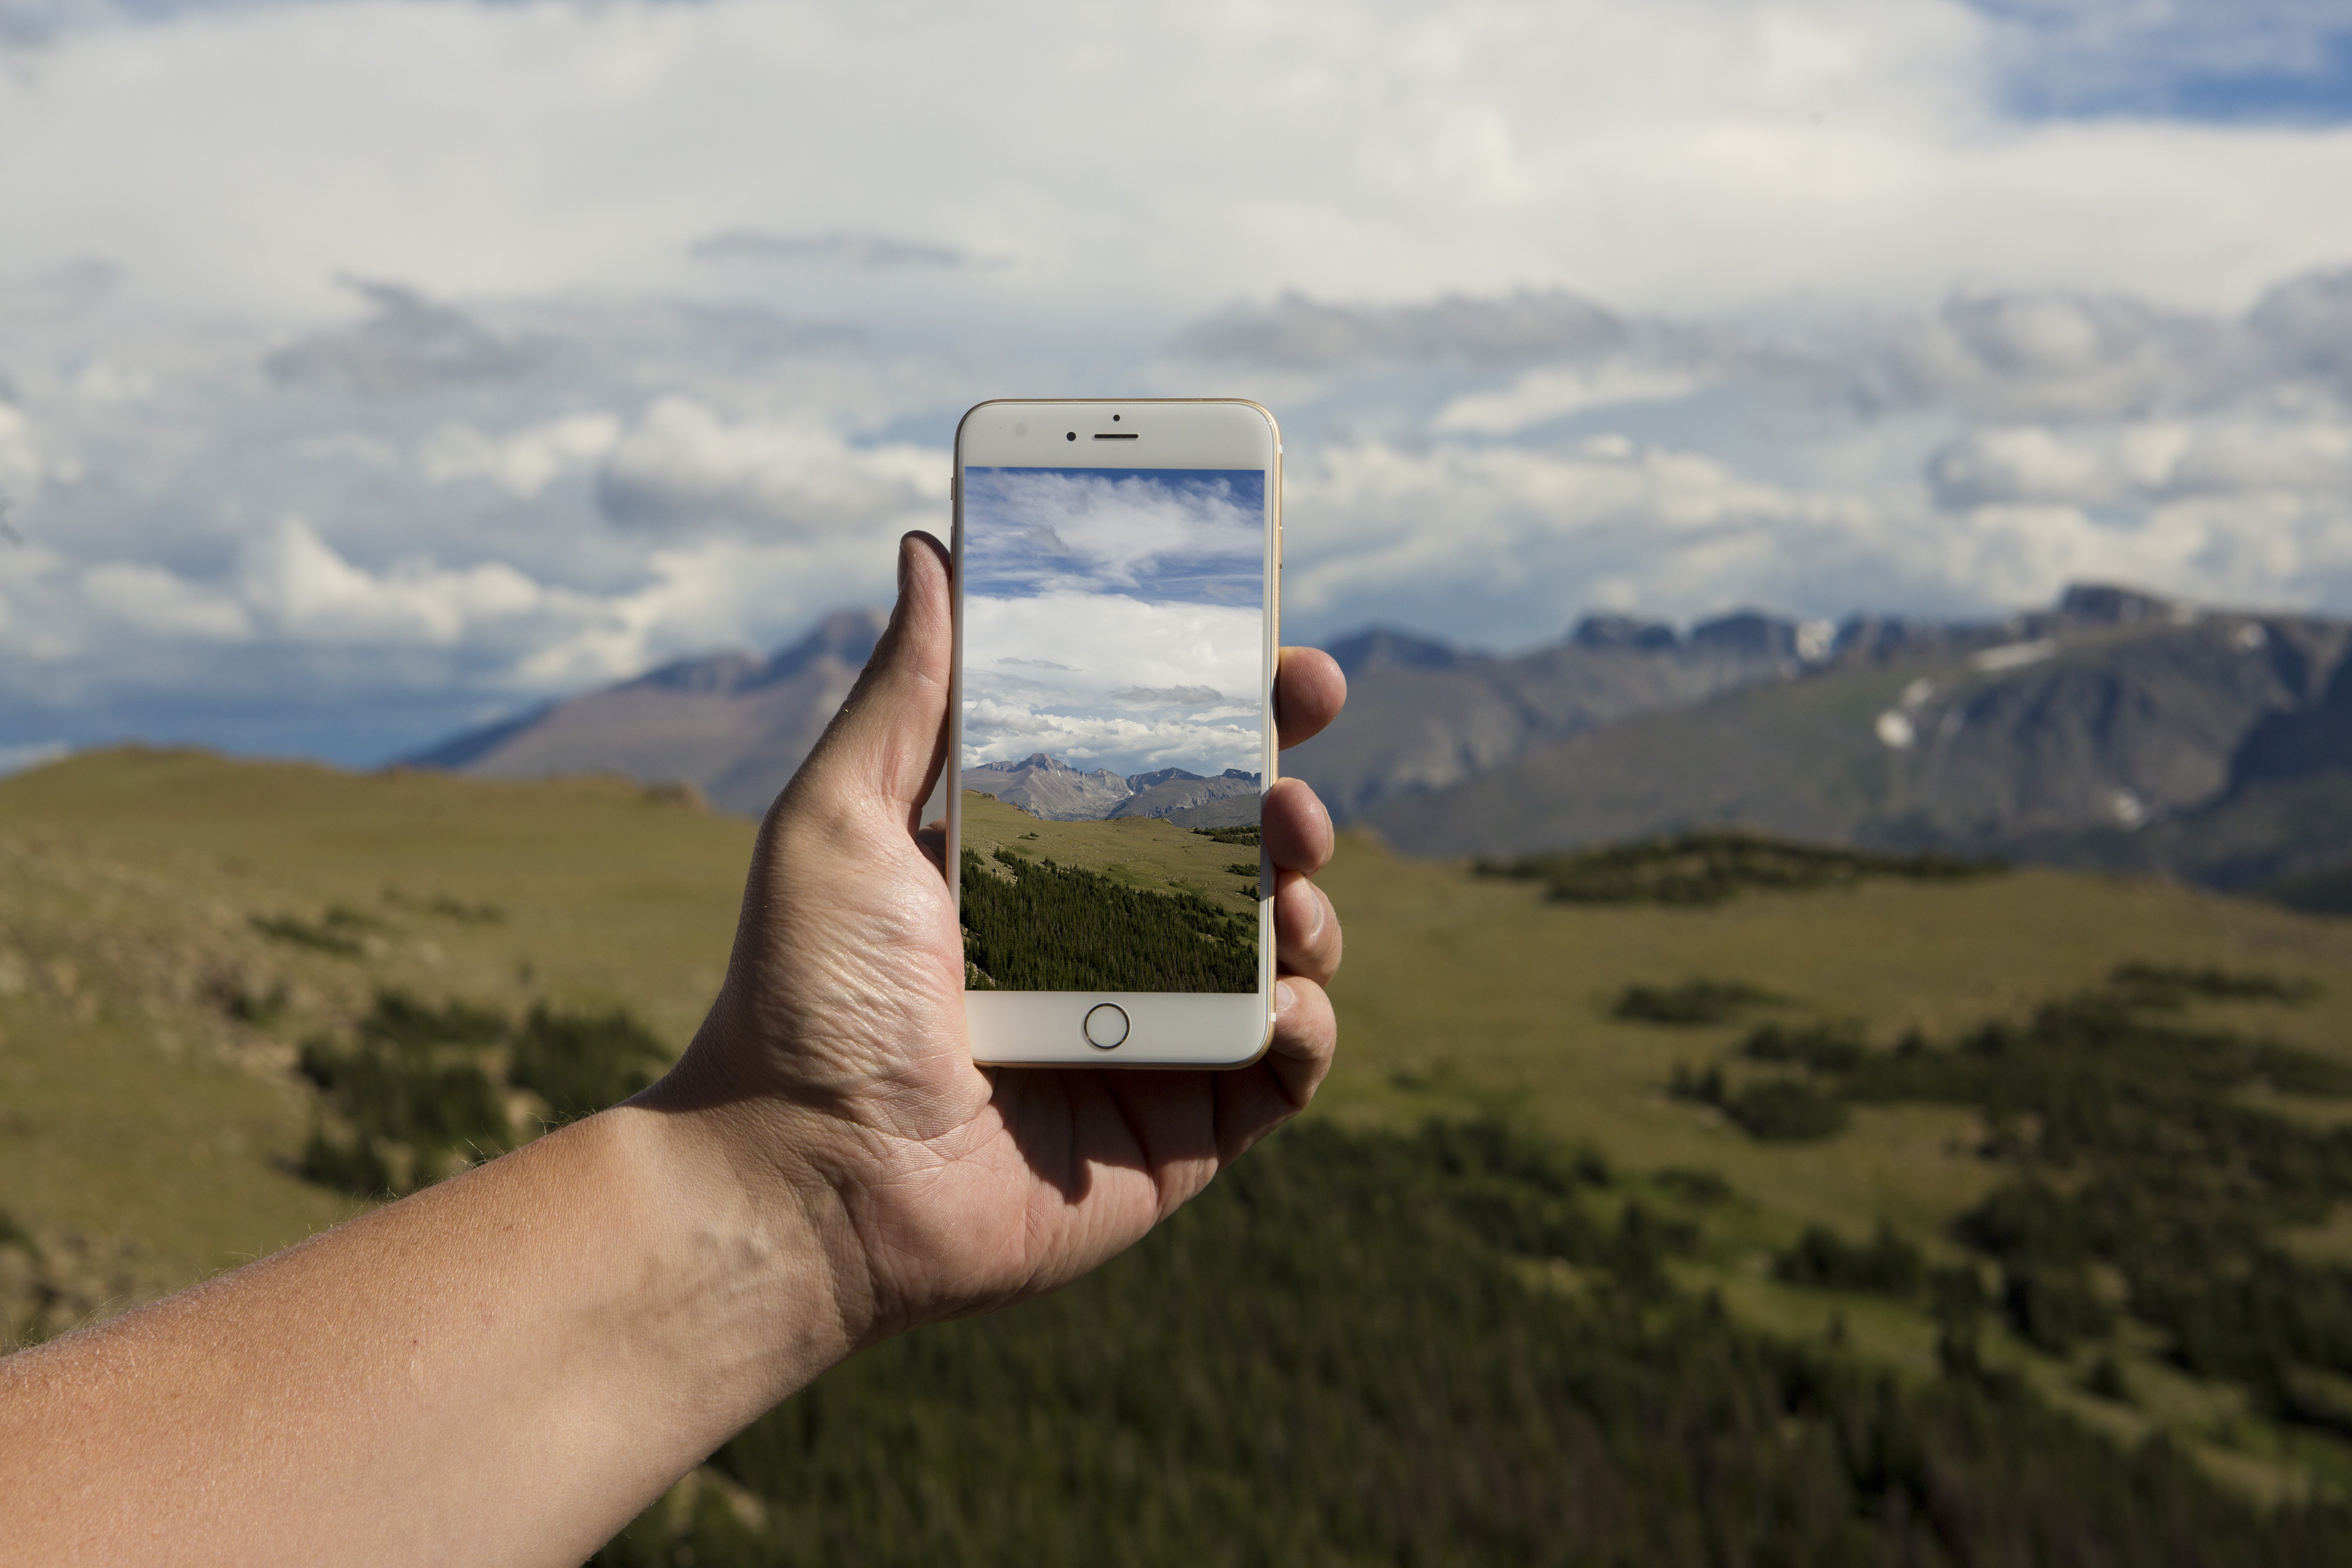
A number of NASA projects use mobile phone applications (apps) to put satellite data into the palm of your hand and allow intrepid citizen scientists to upload data. Credit: NASA.
These blooms can be large enough to be seen both with the naked eye, and from space via images from Earth-observing satellites. As part of this ongoing, long-term mission, a mobile phone application now combines satellite information with user-uploaded data about potentially harmful algal blooms of cyanobacteria.
Developed with the U.S. Environmental Protection Agency (EPA), the mobile phone app, includes NASA supercomputing power, and provides weekly reports on the color and other water quality information of more than 2,000 lakes across the U.S. Users can choose particular lake and see a color-coded index of water quality. The app also allows users to submit data, turning each user's report into a data source for water quality managers to review and confirm the data.
While CyAN is one hand-held way to track water quality, NASA remote sensing data is incorporated into other water quality resources, for example NASA is refining the Freshwater Health Index with the non-profit group Conservation International. This index views water as part of a system that also takes into account data on human population centers as well as, environmental and other data. In addition to creating resources like the index, NASA also trains people to use them. For example, the Earth Applied Sciences Capacity Building program area holds both in-person and remote training courses on the Freshwater Index, how to monitoring harmful algal blooms and many more courses on how to access and interpret Earth observation data.
Too Much and Too Little
While water quality is an issue, so is quantity. Having too much or too little water can be devastating. In addition to NASA's precipitation missions, two other key NASA satellite missions have broken new ground in monitoring the world's water.
The Soil Moisture Active Passive (SMAP) satellite, launched in 2015, measures the amount of water in the top two inches (5 centimeters) of soil. This near-real-time data maps global soil moisture, providing links between Earth's water, energy and carbon cycles. For example, this data incorporated into a NASA software application called the Land Information System and with other resources, provides users with crucial information on soil saturation, drought forecasting and agriculture.
NASA also tracks water through the Gravity Recovery and Climate Experiment Follow-on (GRACE-FO) mission. A partnership between NASA and the German Aerospace Center, GRACE-FO is a successor to the GRACE mission, which made observations from 2002 to 2017.
The GRACE-FO mission consists of two twin satellites that follow each other in orbit around the Earth and are separated by only about 137 miles (220 km). By constantly measuring the distance between them, they track changes in Earth's gravity field, which is influenced by differences in mass, such as when passing near and then over a mountain range. While these changes would be imperceptible to us, the extremely precise measurements of distance between the two satellites reveal gravity changes worldwide.
The data are used to construct monthly maps of the Earth's average gravity field, offering details of how mass, is moving around the planet, which on the scale of monthly is mostly attributable to water movement. Thus GRACE-FO data is able to be used to uncover changes in underground water storage, the amount of water in large lakes and rivers, root-zone soil moisture, ice sheets and glaciers, and sea level caused by the addition of water to the ocean. These discoveries provide a unique view of Earth's climate and have far-reaching benefits to society.
Water Data Everywhere
Despite all of our ways of tracking and monitoring the quality and quantity of water around our world, there is still much to learn about how to best watch the world's water, especially as climate change is shifting the water cycle and affecting water availability around the world.
NASA's satellite and modeling products provide a huge volume of valuable global water resources information, extending back for years across a broad range of areas (from local to global) and across many timescales (from hourly to decades), and while this information is used for ongoing scientific research, many of the resources are available in near-real-time which can make them useful for applications like responding to a hurricane or drought.
All NASA data are free, and openly available, allowing everyone to get access to the information - all with a goal of watching and protecting the water on our pale blue planet.